My Obsidian Knowledge Graph
Graph View
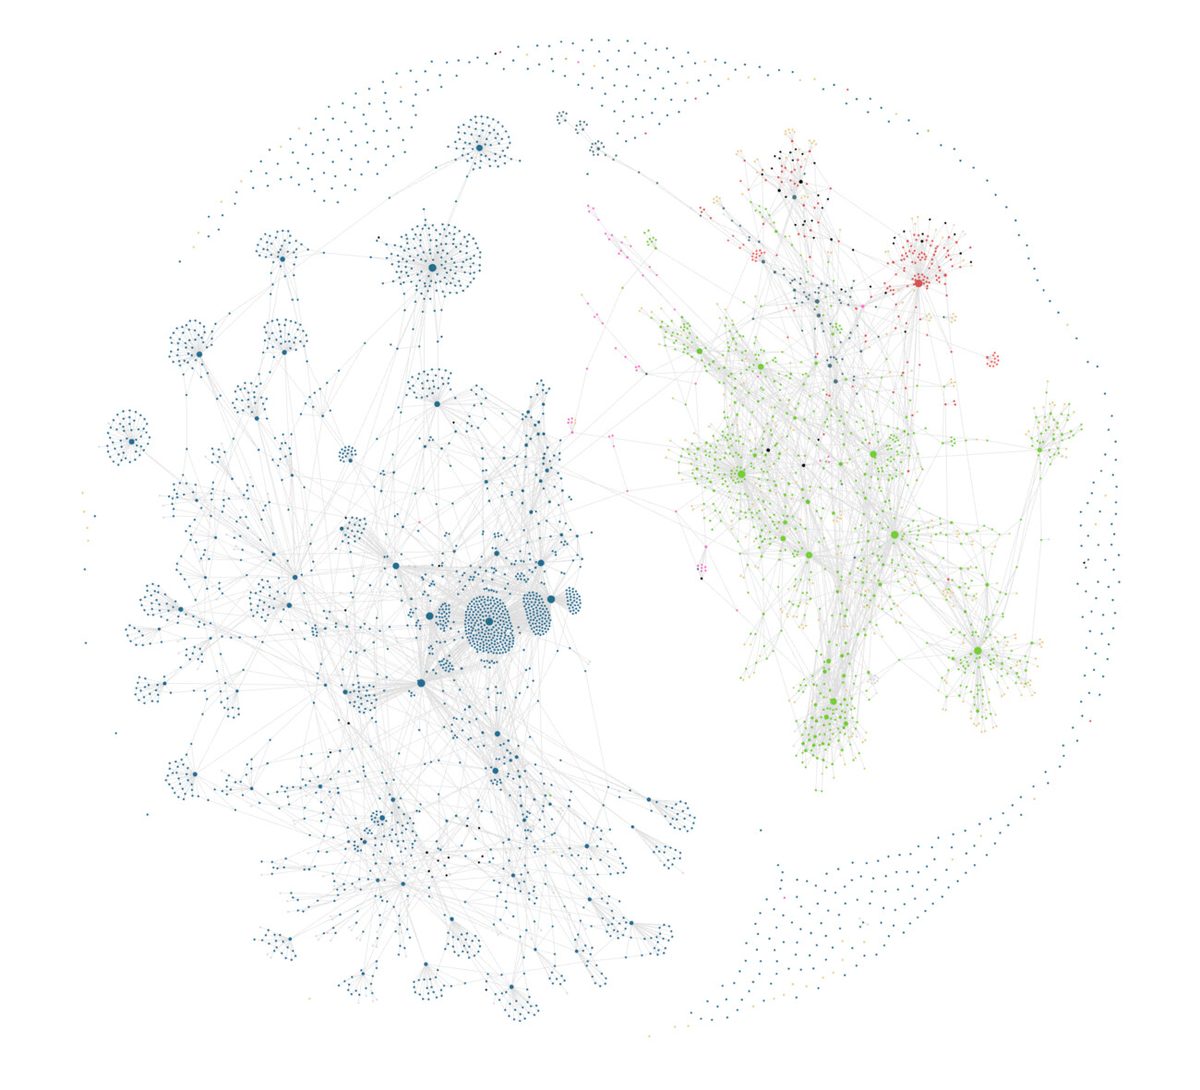
This is the knowledge graph of my second brain, markdown notes written in Obsidian. It stores ideas, thoughts, and knowledge.
The colors represent individual groups, defined via folders, tags, or keywords. In my case, the colors represent overarching topics:
- Green → University Notes
- Blue → Bible Study Notes
- Red → Other (Inbox, Projects, Blog, Private)
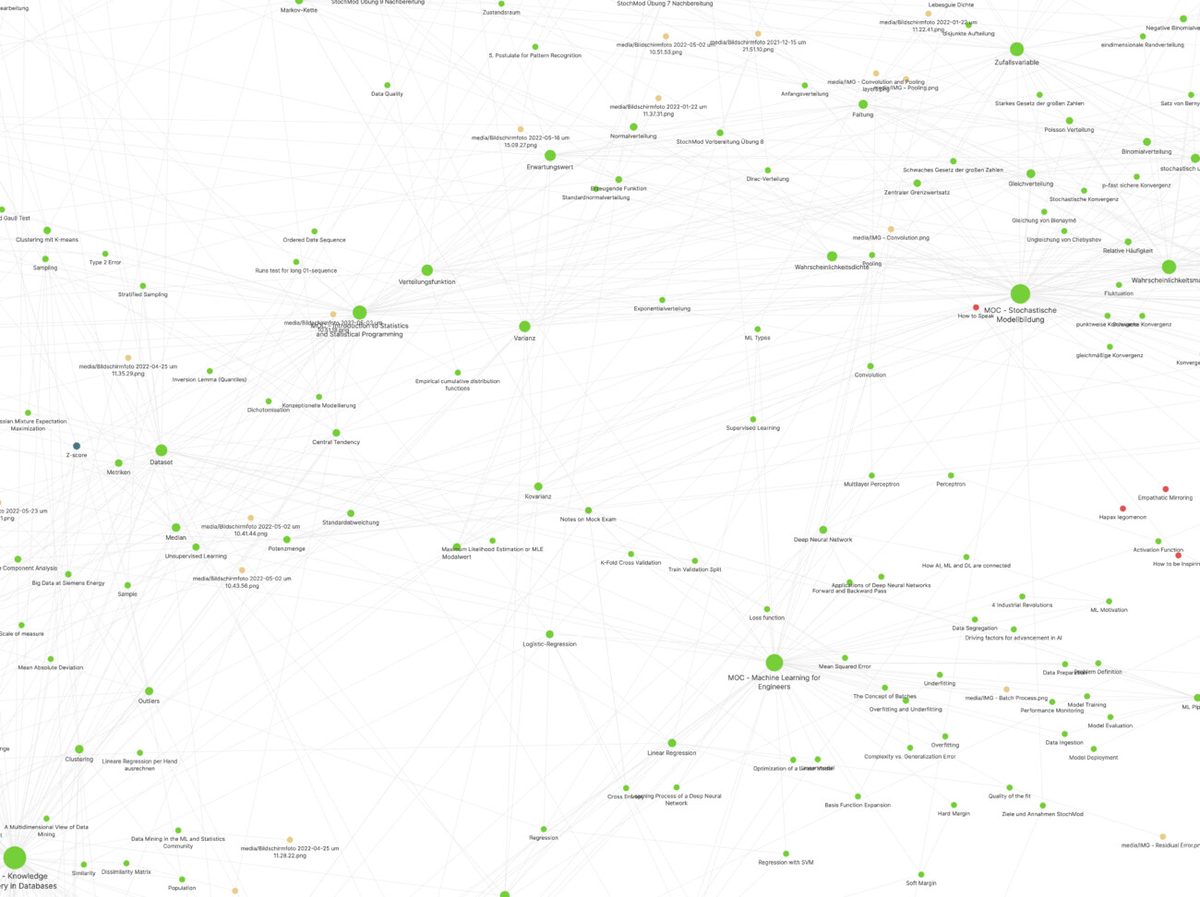
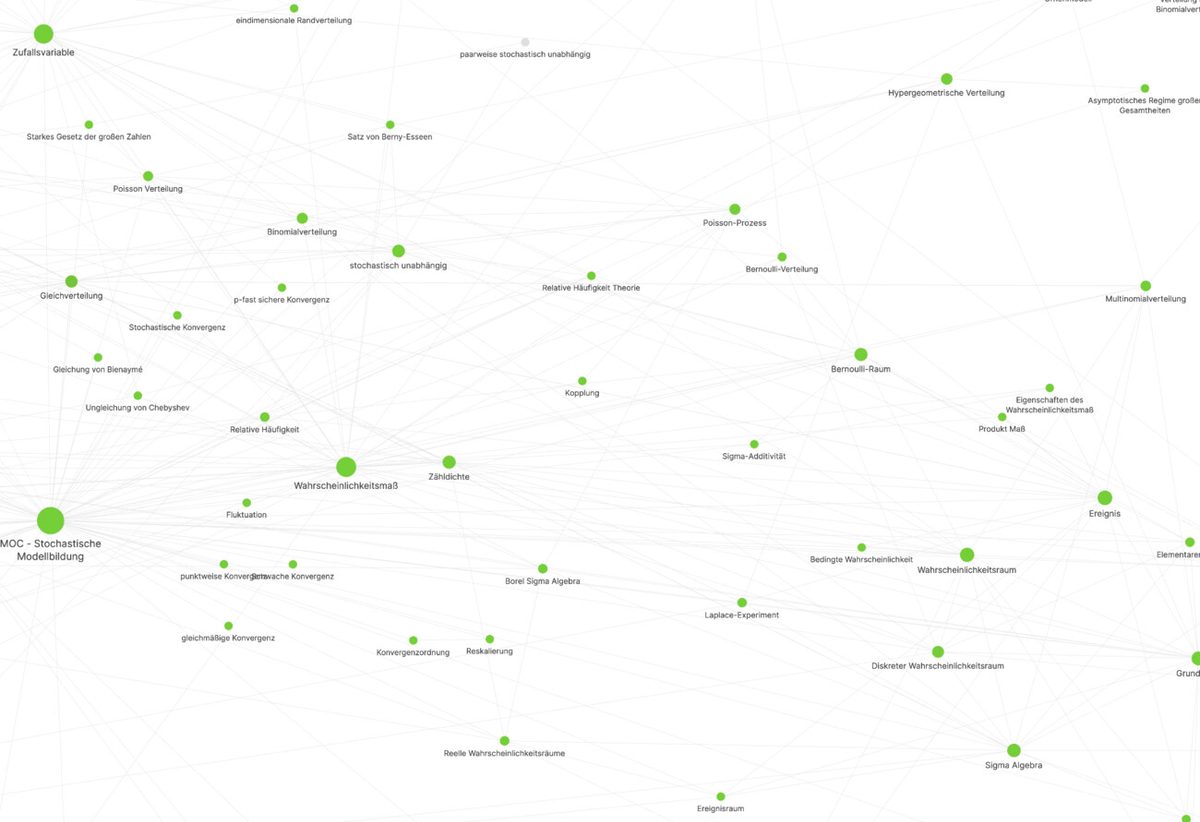
Zooming in reveals the more complex graph structure with its links between notes of different topics. The note names become readable, and you can see distinct links.
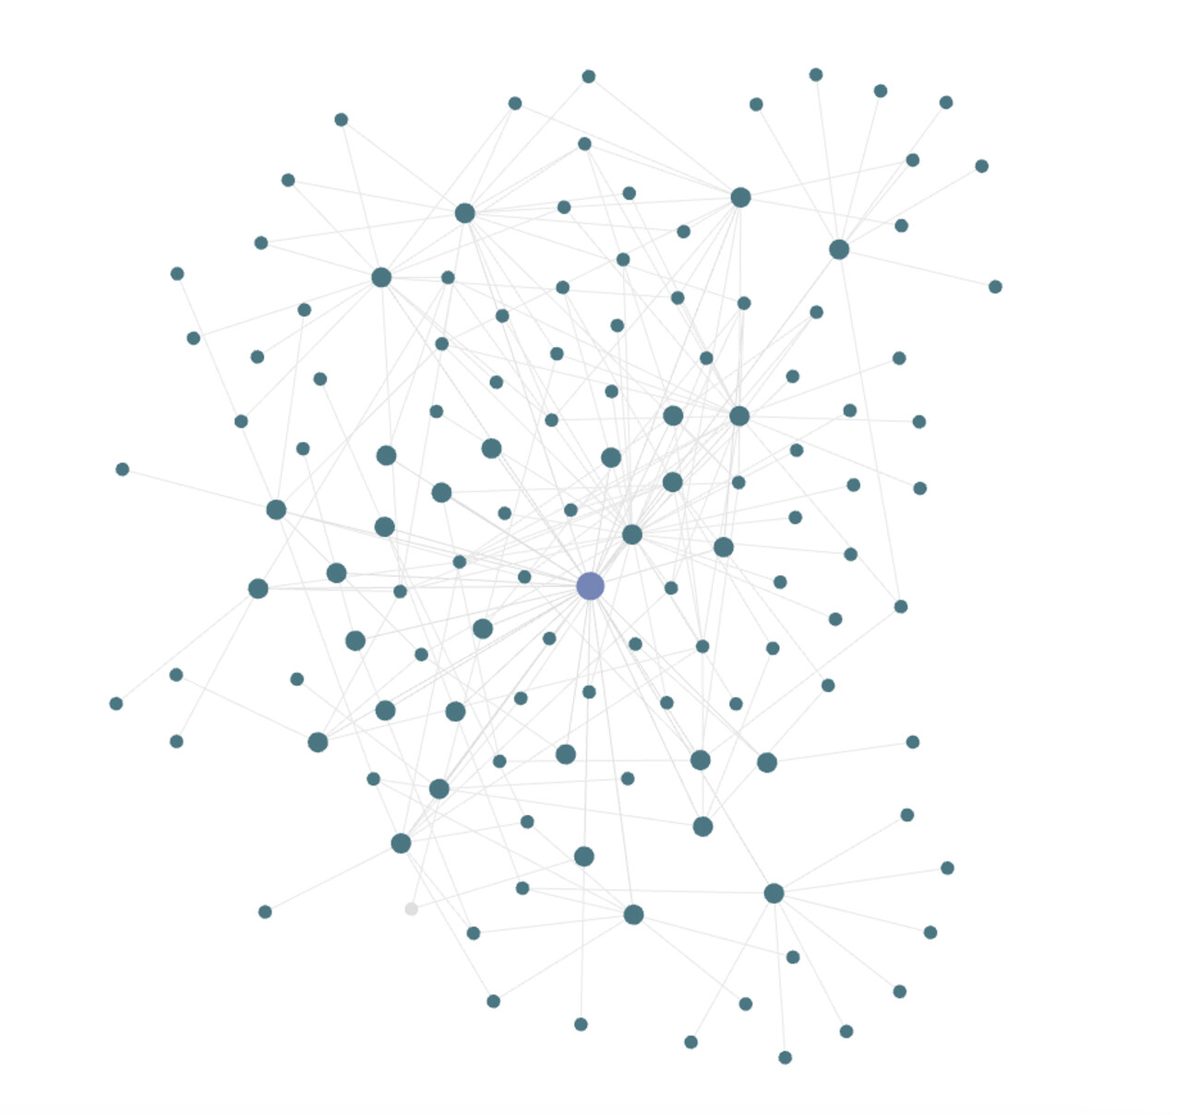
Local Graph
The local graph allows you to see specific parts of the graph that relate to one note. For example, the following image shows a local graph with a depth of 2, which means that notes with a distance of up to 2 edges are part of it. This can be helpful for navigating between notes on the same topic.